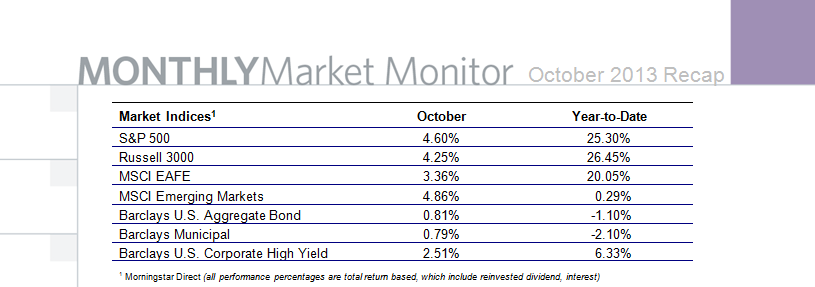
The benchmark S&P 500 Index surged 4.6% in October for its best monthly gain since July and is on pace for its highest annual performance in a decade. Equities were supported by a cooperative stimulus policy from the Federal Reserve that kept intact the $85B in monthly bond purchases. Surprisingly, October’s advance overcame early pessimism associated with the partial government shutdown during the first half of the month. The 16-day closure of non-essential federal services was caused by a partisan impasse over the future of government spending and reaching the statutory debt ceiling. Cooler heads prevailed to end the debacle as Congressional leaders agreed to temporarily extend the debt limit, precluding a possible U.S. debt default. The October rally was also supported by generally stronger quarterly earnings with third quarter profits growing by an average of 5% YoY, while sales expanded by nearly 3%. Analysts forecast overall third quarter earnings growth of 3.7% and 7.5% in the fourth quarter.
Smaller-capitalized stocks underperformed large-caps as the Russell 2000, a proxy for small-cap equities, rose 2.5% last month. On a year-to-date (YTD) basis, the small-cap measure widely outperformed large-caps, gaining 30.9%. Growth stocks fractionally edged out value as the Russell 1000 Growth Index gained 4.42% in October while the Russell 1000 Value Index rose 4.38%. On a YTD basis, growth also beat value as the Russell 1000 Growth Index rose 26.2% versus 25.8% for the Russell 1000 Value Index. Commodities, as measured by the S&P GSCI Index, lagged stocks and bonds in October, falling 1.4%. Gold futures fell 0.2% in October, slightly extending its bear market YTD loss of 21%. West Texas Intermediate (WTI) crude oil futures fell 5.4% in October, reaching a four-month low of $96.38/bbl.
All ten major sector groups extended monthly gains with Telecom (+8.5%), Consumer Staples (+6.4%) and Industrials (+5.1%) advancing the most. Financials (+3.3%) gained the least. For the year, Consumer Discretionary (+35.1%), Healthcare (+34%) and Industrials (+30.3%) are the biggest winners. Utilities have gained the least so far this year, up 14.4%.
Overseas developed markets underperformed the U.S. last month as the MSCI EAFE Index returned 3.4%. Emerging markets, as measured by the MSCI Emerging Markets Index, returned 4.9% in October after climbing 6.5% in September, its first two-month gain since January. The MSCI Emerging Market Index more than entirely erased its prior YTD loss. China’s Shanghai Composite Index fell 1.5% in October, extending its YTD loss to 5.6%.
Treasuries, as measured by the Barclays U.S. Government Bond Index, returned 0.5% on the month, trimming its YTD loss to 1.5%. The yield on 10-year U.S. Treasury notes declined by six basis points in October to end the month at 2.55%. U.S. investment grade bonds, as measured by the Barclays U.S. Aggregate Bond Index, returned 0.8% last month, trimming its YTD loss to 1.1%. Municipal bonds, as measured by the Barclays Municipals Index, gained 0.8% in October and reduced its YTD loss to 2.1%. The Barclays U.S. Corporate High Yield Index, a proxy for non-investment grade corporate bonds, returned 2.5%, boosting its YTD gain to 6.3%.
This information is compiled by Cetera Financial Group. No independent analysis has been performed and the material should not be construed as investment advice. Investment decisions should not be based on this material since the information contained here is a singular update, and prudent investment decisions require the analysis of a much broader collection of facts and context. All information is believed to be from reliable sources; however, we make no representation as to its completeness or accuracy.
Securities and insurance products are offered by Cetera Investment Services LLC (doing insurance business in CA as CFGIS Insurance Agency), member FINRA/SIPC. Cetera Investment Services is not affiliated with the financial institution where investment services are offered. Investment products are: * Not FDIC/NCUSIF insured * May lose value * Not financial institution guaranteed * Not a deposit * Not insured by any federal government agency.
All economic and performance information is historical and not indicative of future results. The market indices discussed are unmanaged. Investors cannot directly invest in unmanaged indices. Please consult your financial advisor for more information.
Additional risks are associated with international investing, such as currency fluctuations, political and economic instability, and differences in accounting standards. |
